Case Study: Staffing Planning at the University of Zurich
The Zentrum für Reisemedizin at the University of Zurich is Switzerland’s leading travel medicine clinic. Over 100 people work there in clinical and administrative roles. Many of them are students, work part-time, or split their day between the clinic and research. That makes staffing and capacity planning hard.
Planning at ZRM worked because the person in charge knew the operation inside out. She knew who was available, who was trained for what, and who preferred which shifts. That knowledge had built up over years, and most of it lived with her, not in a system. When she was on unplanned leave for a while, two colleagues took over and had to piece the picture back together from the existing planning system, a Teams channel, post-it notes, an email inbox and an Excel list. That was when the clinic decided to do something about it.
On top of the planning bottleneck, there was a second issue. ZRM sometimes hired extra staff to absorb fluctuations in demand and employment levels. Some days, specific disciplines were short-staffed, for instance due to sick leave. There was no staffing key to plan against.
This is not a problem only clinics have. It is a process problem: the official system holds the formal data, but the actual work depends on context that lives outside it.
The System Didn’t Match the Workflow
ZRM uses Polypoint PEP, an established system for shift and duty planning that also connects to the University’s HR system. What was missing was a view of how employment levels develop over the longer term. That made it hard to plan ahead. Employee preferences were also difficult to account for unless the planner tracked them separately, outside the platform.
Daily planning had grown out of the system entirely. Whoever from the management team was on duty that day read the plan in PEP and retyped it into a Word table and a Teams channel. The front desk printed that table every morning so reassignments could be pencilled in by hand.
This happens a lot, across industries. The system of record does its job, but a few workflows don’t fit into it. Those end up in spreadsheets, in emails, and in people’s heads.
We started the project in February 2026. Within a month, ZRM had a prototype it could react to. Since July 2026, the clinic works with the software, planIQ, every day.
Key Decisions
Keep the System of Record
Polypoint PEP, ZRM’s existing planning platform, doesn’t cover everything they needed. But as the system of record for shift planning, it connects to central HR processes and carries workflows around the planning. Replacing it was explicitly a non-goal.
So planIQ had to sit next to PEP. PEP stayed the source for official shift and employment data. planIQ used that data for the planning work that had previously happened around PEP: long-term staffing scenarios, competencies, preferences, and the printed daily plan.
Let the Prototype Shape the Concept
The goal for planIQ was to give planners an interface that actually helps them. If you want to go live within months, the discussions about scope need to happen early. A prototype made those discussions concrete: people could try the workflows, react to the screens, and decide what the app really needed to do. It also made clear early on which data we’d need from PEP.
Treat Hosting as Part of the Product
An agentic coding platform helped us move fast early on. Once the concept was clear, though, we brought the infrastructure in-house. Staffing software works with employee data, and that data needs careful handling. An internal tool like this also has no reason to be reachable from the public internet. So we planned the migration to University IT infrastructure early, rather than running into surprises at go-live.
How that migration works is a topic of its own. I’ll cover how to take an AI-built prototype to production in a separate post.
Data on a Need-to-Know Basis
Vibe-coded apps tend to show whatever data is available. Because this app works with employment data, we deliberately showed only what the work actually requires. That started during development. The prototype needed realistic data, but not real employee data. Agentic coding tools are useful when they can see the shape of the problem: roles, employment percentages, absences, competencies, preferences, edge cases. They don’t need to see actual people.
So the app was developed on pseudonymized demo data: a copy of selected real planning data where names, contact details, personnel IDs and other direct identifiers had been replaced.
Only when the app moved onto University infrastructure did we connect it to the daily data feeds from PEP. Even then, only data relevant to the workflows made it into the app: no salary information, no other sensitive HR data. On top of that, user roles control which parts of the app each person can see. An admin sees more than a planner, and a planner sees more than an employee.
Handover to Internal IT
The project didn’t end when the app went live. Internal IT needed to know how the app was built, what infrastructure it runs on, and above all, how to extend it after handover. Today, the department’s IT team handles minor changes themselves, with the support of coding agents. The project carries its own context: the original brief, the design patterns, and a decision log that explains why things work the way they do. A small change request doesn’t have to become a new project.
The Solution
planIQ is an internal web application running on University IT infrastructure. It receives daily updates on personnel, absences like parental leave or holidays, and the employment details needed for planning.
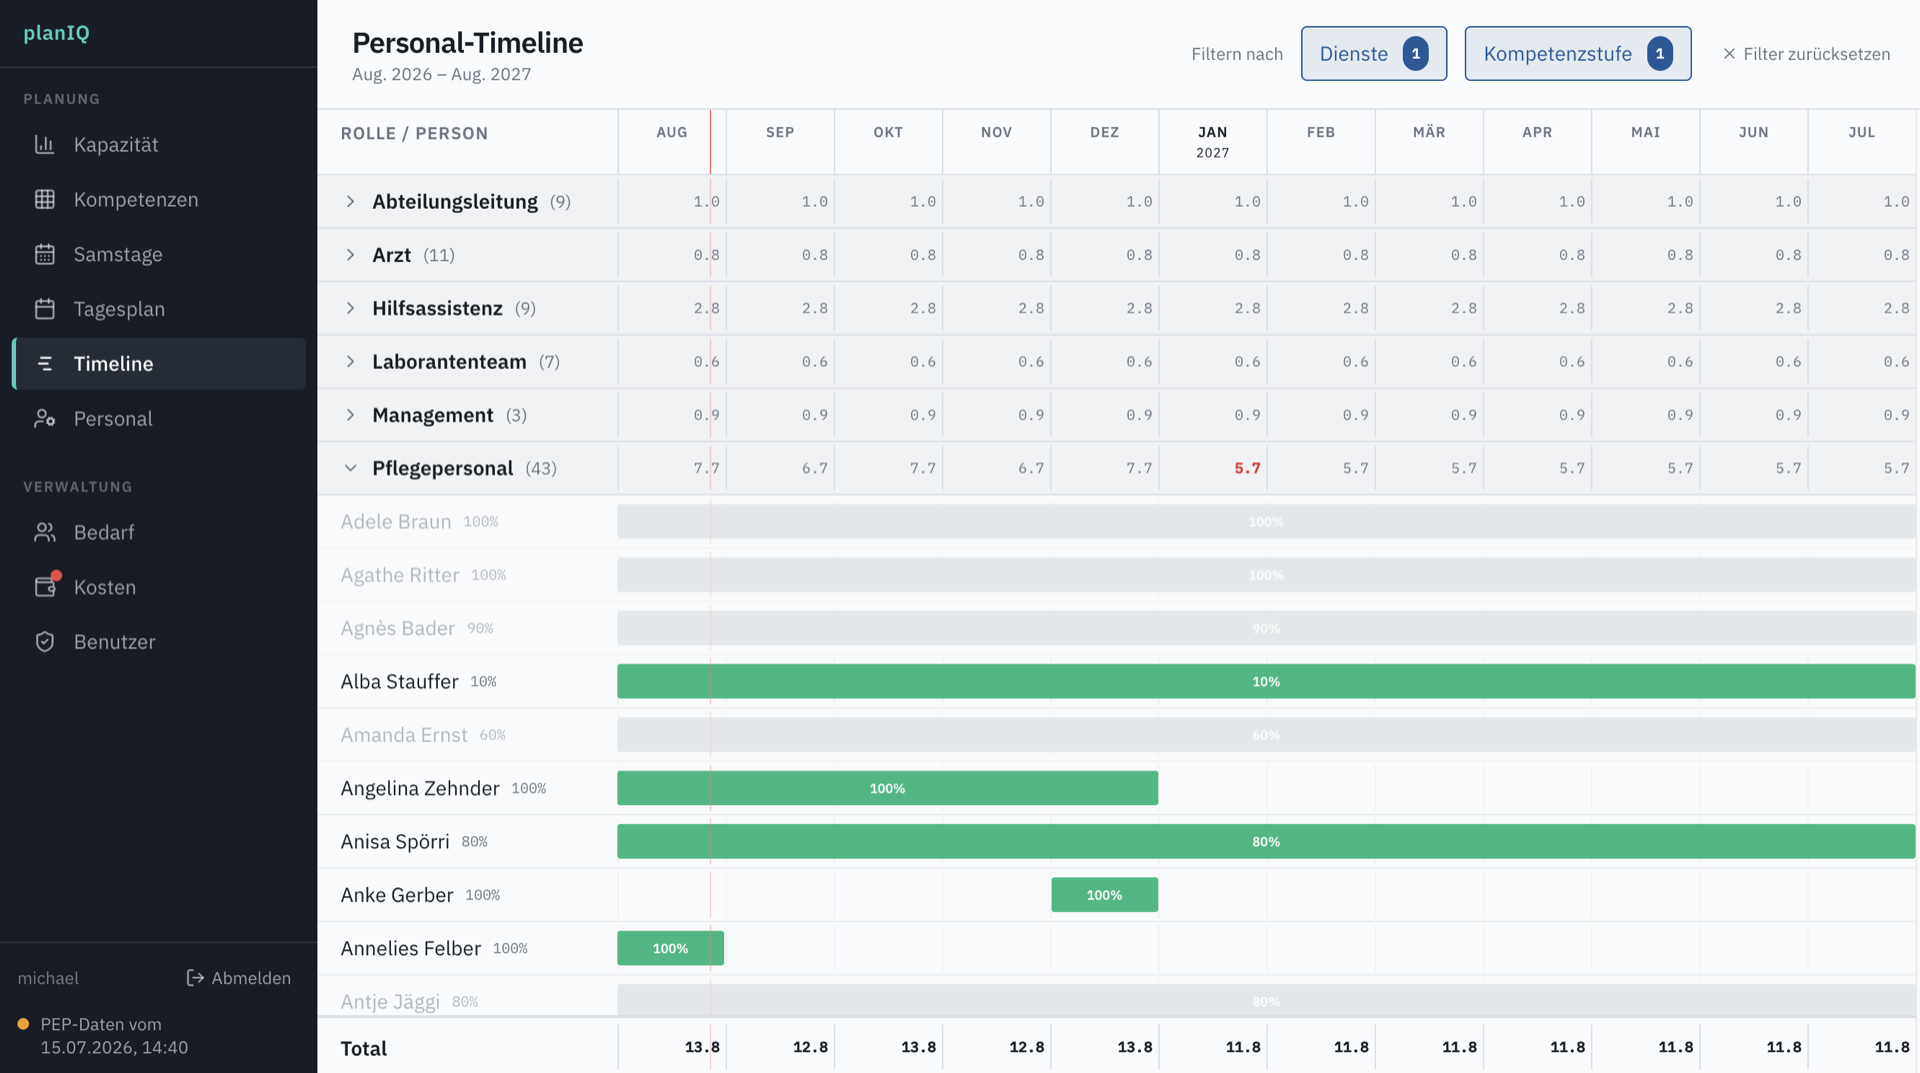
The software covers three main scenarios:
- Long-term staffing scenarios: “Do we have enough of the right competencies next November, even with people on leave? Or are we already overstaffed?”
- Competencies and preferences: “Who can cover travel consultations based on their training?”
- Daily planning: “Who works which shift today?”
 Competency matrix in planIQ: planners see who is qualified for which services, at what level, and how many qualified people are available per area. Screenshot with pseudonymized demo data.
 Capacity planning in planIQ: surplus and shortfall per service across twelve months. Screenshot with synthetic capacity and demand data.
Results
planIQ has been in daily use since July 2026. Two planners work with it weekly, whoever has the day’s supervision opens it every morning, and the department head uses it monthly for the longer view.
What surprised me: daily planning was the smallest of the three scenarios and not the reason the project existed. It’s the one that gets used every single day now. Nobody retypes the day plan into Word any more. planIQ generates a formatted PDF at the click of a button, and that’s what the front desk prints. Staff feel that improvement every day.
Planning is faster. More importantly, it no longer depends on one person knowing everything. Anyone who takes over planning can now see who is available, who is qualified for what, and whose preferences have already been accounted for. The plans aren’t just quicker to produce — they’re better. Preferences get honoured more consistently because they live in the same place as the plan, not in someone’s parallel list.
And ZRM can finally answer the hiring question. Before the project, there was no staffing key at all. Today, the clinic can see which competencies will be short in which month and hire against that, instead of hiring extra staff to absorb uncertainty.
“From a business perspective, the project was worth it for the timeline feature alone. It’s interactive and shows me across a full calendar year not just how many FTE we have, but broken down by profile and skill level. That matters because our teams are so mixed. Without planIQ, that matrix organisation just wasn’t visible enough to plan against.”
— Jenny Crawford, Business Manager, Zentrum für Reisemedizin, University of Zurich
When This Approach Makes Sense
A few things were in place at ZRM that made this project possible. If you’re considering something similar, it’s worth checking whether they apply to you too.
There was a system of record we didn’t have to touch. The workflows we built already existed somewhere — in Word, in Teams, or in someone’s head — so we didn’t have to guess whether anyone would use them. The data was sensitive but limited enough that we could be strict about what the app was allowed to see. And there was an internal IT team willing to take over the app at the end.
If any of those is missing, I’d probably give different advice. If the underlying process doesn’t work, an app won’t fix it. And if nobody in the organisation can maintain the app afterwards, the project will run into trouble within days of going live.
If that sounds like something you recognise in your own organisation — a workflow that’s fallen out of your main system and now lives in a spreadsheet, a Word document, or one person’s head — get in touch.
“As a planner, it wasn’t just about finally having everything in one place. It’s that the tool can show me at any point where I need to act. Tracking skills, noting individual arrangements with each employee, running planning scenarios, checking coverage, creating the day plan — all of that used to happen in separate views and apps. Now it’s all in one place, it’s all connected, and I can see live in the charts what effect each change has.”
— Cécile Rasi, Project Lead, Zentrum für Reisemedizin, University of Zurich
Share
About the Author